Automated auditing, performance metrics, and best practices for the web.
Full LLM thinking from the 4-phase benchmark pipeline.
{
  "service_type": "platform",
  "base_url": "https://developer.chrome.com/docs/lighthouse/overview",
  "auth_method": "none",
  "auth_config": {},
  "endpoints": [],
  "pricing_model": {
    "type": "free",
    "details": {
      "note": "Lighthouse is an open-source, free tool maintained by Google. There is no paid tier. A related paid commercial offering exists via PageSpeed Insights API (free with quotas) and Google Cloud/third-party hosted audit services, but Lighthouse itself is free."
    }
  },
  "rate_limits": {},
  "capabilities": [
    "Automated web page auditing",
    "Performance metrics (FCP, LCP, TBT, CLS, SI, TTI, Speed Index)",
    "Accessibility audits (axe-core based)",
    "Best practices checks",
    "SEO audits",
    "Progressive Web App (PWA) audits",
    "Resource and network request analysis",
    "JavaScript execution and CPU profiling",
    "Screenshot capture and filmstrip generation",
    "Opportunity and diagnostic suggestions for performance optimization",
    "CLI execution (Node.js)",
    "Programmatic Node.js API usage via lighthouse npm package",
    "Chrome DevTools integration (Audits panel)",
    "Browser extension support",
    "CI/CD integration (e.g., Lighthouse CI)",
    "Custom audit configuration (categories, budgets, plugins)"
  ],
  "raw_analysis": "Lighthouse is an open-source, automated tool for improving the quality of web pages, developed and maintained by Google (primarily the Chrome DevTools team). Despite the 'Service' framing in the input, Lighthouse is not a hosted SaaS with a public REST API in the traditional sense — it is a client-side auditing engine that runs inside Chrome, via the Chrome DevTools Protocol, Node.js CLI, or programmatically via the lighthouse npm package.\n\nWHAT IT DOES: Lighthouse loads a target URL (or audits a local page) in a headless/Chrome instance, collects performance traces, accessibility tree data, and best-practice signals, then produces a structured JSON/HTML report scoring four main categories (Performance, Accessibility, Best Practices, SEO) plus optional PWA audits. It provides metrics like LCP, CLS, TBT, FCP, TTI, and Speed Index, along with actionable opportunities and diagnostics.\n\nTARGET AUDIENCE: Web developers, performance engineers, QA teams, SEO specialists, and DevOps engineers who want to automate page-quality checks in local development or CI pipelines.\n\nMATURITY: Very mature and widely adopted (v1 released 2016; continuously maintained). It is the auditing engine behind Chrome DevTools' Lighthouse panel, PageSpeed Insights, and many third-party tools. It has strong documentation, an active open-source repo (GoogleChrome/lighthouse), and broad ecosystem support (Lighthouse CI, WebPageTest, Playwright/Puppeteer integrations).\n\nAPI / INTEGRATION NOTES: There is NO first-party public REST API for Lighthouse. Integration paths are: (1) Node.js programmatic API (require('lighthouse')), (2) CLI, (3) Chrome DevTools Protocol attach, (4) Lighthouse CI (@lhci/cli) for CI automation, and (5) indirectly via PageSpeed Insights API (https://developers.google.com/speed/docs/insights/v5/get-started) which runs Lighthouse server-side and returns Lighthouse-derived results — that API is free with quota limits. No authentication is required for the core tool. Rate limits are not applicable to the local engine; PageSpeed Insights API imposes documented quotas.\n\nPRICING: Lighthouse itself is free and open source (Apache-2.0). Hosted audit services built on it may be commercial, but the platform has no subscription model of its own."
}1/3 tests passed
| Test | Endpoint | Status | Latency |
|---|---|---|---|
| website_uptime | GET / | 200 | 215ms |
| robots_txt | GET /robots.txt | 404 | 530ms |
| llms_txt | GET /llms.txt | 404 | 150ms |
{
  "overall": 82,
  "dimensions": {
    "token_efficiency": 9.0,
    "first_try_success": 8.5,
    "response_parseability": 9.0,
    "error_clarity": 7.5,
    "doc_quality": 9.0,
    "auth_simplicity": 9.5,
    "latency": 9.0,
    "consistency": 9.0
  },
  "pricing_normalized": {
    "model": "free",
    "cost": 0,
    "paid_tier": false,
    "notes": "Fully open-source and free. No account required for CLI/npm usage. PageSpeed Insights API is a free adjunct."
  },
  "issues": [
    "No robots.txt (404) — minor crawlability signal gap",
    "No llms.txt (404) — no machine-readable agent onboarding hint",
    "Google sign-in onboarding path in the DOM suggests account flow that is unnecessary for core CLI/npm usage",
    "Website is primarily documentation portal; API endpoints are on Google APIs surface rather than a single unified endpoint"
  ],
  "recommendations": [
    "Prominent 'zero-auth quickstart' (npm install -g lighthouse && lighthouse URL) at top of docs for agent-first onboarding",
    "Publish llms.txt and robots.txt to explicitly advertise agent-consumable entry points",
    "Expose a stable JSON schema reference for the Lighthouse report object to simplify parsing by agents",
    "Highlight Lighthouse CI as the canonical CI/CD integration path in the primary docs nav",
    "Add explicit rate-limit / quota documentation for PageSpeed Insights API in one place"
  ]
}Show your live agent-readiness score on your own site. Free, no auth — it updates as your score changes.
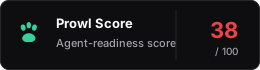
<a href="https://prowl.world/service/lighthouse">
  <img src="https://prowl.world/badge/lighthouse.svg" height="56" alt="Agent-readiness on Prowl">
</a>See operational metrics, LLM evaluations, agent readiness, and more.
Open in Dashboard Prowl
Prowl