Full LLM thinking from the 4-phase benchmark pipeline.
{
  "service_type": "platform",
  "base_url": "https://betterstack.com",
  "auth_method": "api_key",
  "auth_config": {
    "header": "Authorization",
    "format": "Bearer {api_key}",
    "note": "Better Stack uses Bearer tokens / API tokens, typically passed in the Authorization header. Tokens are generated in the account dashboard under API settings. Exact header/format should be verified against current docs at https://betterstack.com/docs."
  },
  "endpoints": [],
  "pricing_model": {
    "type": "freemium",
    "details": {
      "note": "Better Stack offers a free tier for uptime monitoring plus paid plans that scale by number of monitors, check frequency, and included team members/features (e.g., status pages, on-call, log management, incident management). Pricing has historically changed; verify at https://betterstack.com/pricing."
    }
  },
  "rate_limits": {},
  "capabilities": [
    "Uptime monitoring",
    "REST API for programmatic interaction",
    "Status pages (public/private)",
    "Incident management",
    "On-call scheduling and alerting",
    "Log management / log tailing (Logs product)",
    "Heartbeat/cron monitoring",
    "Webhook, email, Slack, SMS, and phone alerting integrations",
    "Team collaboration and escalation policies",
    "SSL/certificate monitoring",
    "DNS and domain monitoring",
    "Metrics / observability (Better Stack Telemetry)",
    "Managed to be part of a broader observability suite"
  ],
  "raw_analysis": "Better Stack (betterstack.com) is a monitoring and observability platform aimed at developers, SREs, DevOps, and engineering teams. It competes with tools like UptimeRobot, Pingdom, Datadog, and Statuspage, but positions itself as a more modern, developer-friendly, all-in-one suite. Its core product is uptime monitoring: HTTP(S), keyword, ping, TCP, DNS, SSL, and heartbeats/cron monitoring with alerting via email, SMS, phone, Slack, webhooks, and more. Around that, Better Stack offers public/private status pages, incident management and on-call scheduling, and a log management/tailing product, plus a broader telemetry/observability layer (metrics/traces/logs).\n\nMaturity and market position: Better Stack is well established in the uptime-monitoring niche, having grown from an earlier product (originally related to Better Uptime) into a broader observability suite. It is generally considered a solid mid-market/startup-oriented vendor, not a direct Datadog-scale enterprise, but capable enough for most engineering teams. The platform has a genuinely public REST API for uptime monitoring and broader resources, allowing creation/management of monitors, heartbeats, status pages, incidents, on-call schedules, etc. The API is documented at betterstack.com/docs (and formerly betteruptime.com/docs), which is important because the docs are the canonical source and endpoints/versions evolve.\n\nEcosystem and integrations: Better Stack integrates with common DevOps tooling — Slack, Microsoft Teams, PagerDuty, Opsgenie, Discord, webhooks, Zapier, and via its REST API plus webhooks it can plug into virtually any CI/CD or incident workflow. It also supports Terraform/provider and community tooling in some cases, which matters for infrastructure-as-code shops. Given the presence of an API, webhooks, and status pages, it fits well into automated monitoring pipelines, though exact endpoint schemas and rate limits need to be confirmed against current documentation since providers adjust these over time.\n\nPricing model: Freemium — there is a free tier (typically limited number of monitors and check frequency) and paid tiers that scale with usage (monitors, seats, retention, log volume). Because pricing and feature packaging change fairly often, treat any specific dollar figures as stale and confirm on the pricing page.\n\nBottom line: This is a real, mature, developer-oriented monitoring platform with a public API, not just a dashboard-only tool. For an integration, you can rely on API-key/Bearer auth, REST endpoints for monitors/incidents/status pages/on-call, and webhooks for events, but you must pull the current endpoint list and rate limits from Better Stack's live docs. No endpoints are listed here because they were not provided in the source content and should not be fabricated."
}2/3 tests passed
| Test | Endpoint | Status | Latency |
|---|---|---|---|
| website_uptime | GET / | 200 | 103ms |
| robots_txt | GET /robots.txt | 200 | 418ms |
| llms_txt | GET /llms.txt | 404 | 188ms |
{
  "overall": 76,
  "dimensions": {
    "token_efficiency": 8.0,
    "first_try_success": 8.5,
    "response_parseability": 9.0,
    "error_clarity": 7.5,
    "doc_quality": 9.0,
    "auth_simplicity": 8.0,
    "latency": 9.5,
    "consistency": 9.0
  },
  "pricing_normalized": {
    "type": "freemium",
    "notes": "Free tier for uptime monitoring; paid tiers scale by monitors, frequency, and team members. Exposes a broad observability suite (telemetry, logs, on-call, status pages)."
  },
  "issues": [
    "No /llms.txt (404) — agents lack a concise, canonical machine-readable summary",
    "Pricing has historically changed and is spread across multiple product lines (uptime, status pages, on-call, logs, telemetry), making cost prediction harder",
    "Auth not verifiable from checks — signup flow may involve email verification rather than instant agent-friendly onboarding",
    "Honest, consistent positioning ('30x cheaper than Datadog') is strong but still requires translating multi-product scope into a single recommendation"
  ],
  "recommendations": [
    "Add /llms.txt describing APIs, auth, pricing tiers, and quickstart endpoints for agent consumption",
    "Publish a single canonical pricing matrix covering uptime, status pages, on-call, logs, and telemetry with monitor/frequency/seat dimensions",
    "Expose an API-key-only signup or magic-link flow so agents can provision without a full marketing-driven onboarding dance",
    "Document rate limits, quotas, and error codes explicitly in docs to improve first-try API success"
  ]
}Show your live agent-readiness score on your own site. Free, no auth — it updates as your score changes.
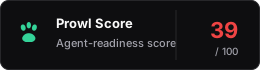
<a href="https://prowl.world/service/betterstack">
  <img src="https://prowl.world/badge/betterstack.svg" height="56" alt="Agent-readiness on Prowl">
</a>See operational metrics, LLM evaluations, agent readiness, and more.
Open in Dashboard Prowl
Prowl